创建图形,即初始化
undirected graph
PUNGraph Graph = TUNGraph::New();
directed graph
PNGraph Graph = TNGraph::New();
directed multi-graph with attributes
PNEANet Graph = TNEANet::New();
Q1:前面为何使用P开头的类?
前面的PNGraph和PUNGraph是为了快速的访问:
//Use smart-pointers
typedef TPt<TNGraph> PNGraph
Q2:PN?? TN??
P应该代表的是Pointers,N不是很清楚,Nodes?T也不是很清楚,Typedef?
添加点和边
Graph->AddNode(v1);
Graph->AddNode(v2);
Graph->AddEdge(v1, v2);
//如果是有向图,则是v1指向v2,即v1->v2.
Graph Traversal
Traverse the nodes
for (TNGraph::TNodeI NI = Graph->BegNI(); NI < Graph->EndNI(); NI++)
    printf("%d %d %d\n", NI.GetId(), NI.GetOutDeg(), NI.GetInDeg());
//跟容器的迭代器一样,这里输出了点的ID,出度和入度。

//输出结果
v1 1 0
v2 0 1
Traverse the edges, globally
for (TNGraph::TEdgeI EI = Graph->BegEI(); EI < Graph->EndEI(); EI++)
    printf("edge (%d, %d)\n", EI.GetSrcNId(), EI.GetDstNId());
//应该是以边,输出一条边的头和尾
Traverse the edges, per node
for (TNGraph::TNodeI NI = Graph->BegNI(); NI < Graph->EndNI(); NI++)
    for (int e = 0; e < NI.GetOutDeg(); e++)
        printf("edge (%d %d)\n", NI.GetId(), NI.GetOutNId(e));
//首先得到一个点,然后输出该点的所有出度点
Node and Edge Iterators
Get a node iterator from node id:
TNGraph::TNodeI NI = Graph->GetNI(NId);
//上面的指针指向的是开始的位置,这里则是NID的位置
Get an edge iterator from node ids:
TNGraph::TEdgeI EI = Graph->GetEI(SrcNId,DstNId);
printf("%d\n",NI.GetId());
printf("%d\n",EI.GetId());
printf("源节点%d\n", EI.GetSrcNId());
printf("目标节点%d\n", EI.GetDstNId());
Q:Src?? Dst??
Loading a graph in the edge list, text format
PNGraph G2 = TSnap::LoadEdgeList<PNGraph>(“as20graph.txt”,0,1);
//0, 1 are the columns of source, target nodes
//0,1表示源节点,目标节点在文件中所在的列号,即第0列为源节点,第1列是目标节点
Loading/Saving of Graphs
Saving a graph in the edge list, text format
TSnap::SaveEdgeList<PNGraph>(G2, "as20graph.txt?, "");
Loading/Saving in a binary format – faster(更快)
{ TFIn FIn("test.graph");
PNGraph G2 = TNGraph::Load(FIn); }
{ TFOut FOut("test.graph"); G2->Save(FOut); }
//Note the parenthesis(圆括号) {}!
Graph Operations(Examples1)
Example file:
as20graph.txt in subfolder examples
# Directed Node Graph
# Autonomous systems …
# Nodes: 6474 Edges: 26467
# SrcNId DstNId
1 3
1 6
1 32
1 48
1 63
1 70
…
TSnap:T应该是SNAP重写的Typedef,如TInt
PNGraph G = TSnap::LoadEdgeList<PNGraph>("as20graph.txt", 0, 1);
//CntV is a vector of pairs of integers :
TVec < TPair<TInt, TInt> > CntV;
//Get degree distribution(degree, count)
TSnap::GetOutDegCnt(G, CntV);
TSnap::GetInDegCnt(G, CntV);
//Get distribution of connected components(component size, count)
TSnap::GetWccSzCnt(G, CntV);
//这里具体的含义是啥?有啥用?
Generating graphs(SNAP中自带的图模型)
Generate graphs with specific properties
Use functions TSnap::Gen…
TSnap::GenRndGnm(): G_nm Erdős–Rényi graph
TSnap::GenForestFire, Forest Fire Model
TSnap::GenPrefAttach, Preferential Attachment
PS:
Erdős–Rényi model随机图模型(Random Graph Model):一个有n个非连通节点的图,以概率p在每对节点间创建边。
Forest Fire Model
Preferential Attachment
特征向量中心性(Eigenvector Centrality):一个节点的特征向量中心性与其临近节点的中心性得分的总和成正比。与重要的节点连接的节点更重要。有少量有影响的联系人的节点其中心性可能超过拥有大量平庸的联系人的节点。这点与PR值类似。
特征向量中心性的计算:
- 计算图的成对临近矩阵的特征分解
- 选择有最大特征值的特征向量
- 第i个节点的中心性等于特征向量中的第i元素
Example:
//Create a directed random graph on 100 nodes and 1k edges
PNGraph Graph = TSnap::GenRndGnm<PNGraph>(100, 1000);
for (TNGraph::TEdgeI EI = Graph->BegEI(); EI < Graph->EndEI(); EI++)
    printf("edge (%d, %d)\n", EI.GetSrcNId(), EI.GetDstNId());
Graph Operations(Examples2)
//Generate a network using Forest Fire model
PNGraph G = TSnap::GenForestFire(1000, 0.35, 0.35);

//Convert to undirected graph TUNGraph
PUNGraph UG = TSnap::ConvertGraph<PUNGraph, PNGraph>(Graph2);
for (TNGraph::TEdgeI EI = Graph2->BegEI(); EI < Graph2->EndEI(); EI++)
    printf("edge (%d, %d)\n", EI.GetSrcNId(), EI.GetDstNId());
for (TUNGraph::TEdgeI EI = UG->BegEI(); EI < UG->EndEI(); EI++)
    printf("edge (%d, %d)\n", EI.GetSrcNId(), EI.GetDstNId());
//将有向图转换为无向图

//Get largest weakly connected component of G
PNGraph Graph5 = TNGraph::New();
Graph5->AddNode(7);
Graph5->AddNode(8);
Graph5->AddNode(1);
Graph5->AddNode(2);
Graph5->AddNode(3);
Graph5->AddNode(5);
Graph5->AddNode(11);
Graph5->AddEdge(1, 5);
//Graph5->AddEdge(2, 5);
Graph5->AddEdge(7, 8);
Graph5->AddEdge(3, 2);
Graph5->AddEdge(3, 11);
PNGraph WccG = TSnap::GetMxWcc(Graph5);
for (TNGraph::TEdgeI EI = WccG->BegEI(); EI < WccG->EndEI(); EI++)
    printf("5edge (%d, %d)\n", EI.GetSrcNId(), EI.GetDstNId());
//弱连接,最大的一个连通块,当最大长度有多个时,会输出值较大的。

//Get a subgraph induced on nodes {0,1,2,3,4}
PNGraph SubG = TSnap::GetSubGraph(G, TIntV::GetV(0,1,2,3,4));
/*
//Create a directed random graph on 100 nodes and 1k edges
PNGraph Graph = TSnap::GenRndGnm<PNGraph>(100, 1000);
//Get a subgraph induced on nodes {0,1,2,3,4}
PNGraph SubG = TSnap::GetSubGraph(Graph, TIntV::GetV(0, 1, 2, 3, 4));
for (TNGraph::TEdgeI EI = SubG->BegEI(); EI < SubG->EndEI(); EI++)
    printf("edge (%d, %d)\n", EI.GetSrcNId(), EI.GetDstNId());
//输出的边只有0,1,2,3,4顶点连接的。
*/
SNAP Network Types
- TNodeNet
: directed graph with TNodeData object for each node - TNodeEDatNet
- TNodeEdgeNet
Example Applications
In SNAP directory “examples”:
- TestGraph: Demonstrates basic functionality of the library, modify this example for your own project
- ForestFire: ForestFire graph generative model
- Cliques: Clique Percolation Method for detectingoverlapping communities
- Cascades: Simulate susceptible-infected model on a network
- AGMFit, BigClam, CODA, Cesna: Community detection methods
SNAP Data Structures and Types
In directory glib-core:
Key files:
- dt.h: Data Types (TInt, TFlt)
- ds.h: Data Structures (TVec)
Numbers:
- Integers: TInt
- Real numbers: TFlt
- Example:
TInt A = 5;
printf(“%d\n”, A.Val);
practice
不用在文件中添加dt.h和ds.h头文件,否则会出现重定义错误。
错误 C4996 ‘strcpy’: This function or variable may be unsafe. Consider using strcpy_s instead. To disable deprecation, use _CRT_SECURE_NO_WARNINGS. See online help for details. TestSnap3 c:\users\administrator\desktop\communitynetwork\snap-4.0\glib-core\bd.h 521
Basic SNAP Types
String: TStr
Examples:
TStr A = "abc";
TStr B = "ccc";
printf(“string %s\n”, A.CStr()); // -- abc
printf(“length %d\n”, A.Len()); // -- 3
printf(“A[0] %c\n”, A[0]); // -- a
printf(“A==B %d\n”, A == B); // -- 0
SNAP Data Structure
Pair
TPair
(Types can also be complex types like TVec, TPair…)
TPair<TInt, TFlt> A;
A.Val1 = 3;
A.Val2 = 3.14;
Predefined types in ds.h
typedef TPair
typedef TPair
Triple
TTriple
SNAP Vectors
TVec
Example:
TVec<TInt> A;
A.Add(10);
A.Add(20);
A.Add(30);
printf(“length %d\n”, A.Len()); // -- 3
printf(“A[0] %d\n”, A[0].Val); // -- 10
“Type” can be a complex type
TVec< TVec< TVec<TFlt> > >
Predefined types in ds.h
typedef TVec<TInt> TIntV;
Typedef TVec<TFlt> TFltV;
SNAP Hash Tables
THash
- Key: item key, provided by the caller(调用者)
- Value: item value, provided by the caller
- KeyId: integer, unique slot(唯一槽) in the table, calculated by SNAP
Example:
THash<TInt, TStr> A;
A.AddDat(100) = “David”;
A.AddDat(89) = “Ann”;
A.AddDat(95) = “Jason”;
printf(“%s\n”, A.GetDat(89).CStr()); // -- Ann, Key to Value
printf(“%d\n”, A.GetKeyId(95)); // -- 5, Key to KeyId
printf(“%d\n”, A.GetKey(5).Val); // -- 95, KeyId to Key
printf(“%s\n”, A[5].CStr()); // -- Jason, KeyId to Value
Predefined types in hash.h
typedef THash<TInt, TInt> TIntIntH;
Typedef THash<TInt, TFlt> TIntFltH;
Saving and Loading Objects
Binary files
- Fast save/load
- Memory efficient
Save():
TIntStrH A;
{ TFOut fout("a.bin");
 A.Save(fout); }
Load():
{ TFIn fin("a.bin"); A.Load(fin); }
Generating Distributions
TRnd class
Generate random numbers according to various probability distributions
根据各种概率分布生成随机数
Example:
TRnd B;
//sample from an exponential distribution
for (int i = 0; i<10; ++i) {
    printf("%f\n", B.GetExpDev(1));
}
//来自指数分布的样本
Calculating Statics(计算静力学)
File glib-core/xmath.h
Useful for calculating moments, correlation coefficients, t-test, …
用于计算时刻,相关性系数,t检验
Example of computing moments (TMom):
TMom Mom;
Mom.Add(5); Mom.Add(6); Mom.Add(8);
Mom.Def();
printf("Avg: %f\n", Mom.GetMean());
printf("Min: %f\n", Mom.GetMn());
printf("Max: %f\n", Mom.GetMx());
Making Plots in SNAP
Gnuplot是用于Linux,OS / 2,MS Windows,OSX,VMS和许多其他平台的便携式命令行驱动图形实用程序。源代码受版权保护,但免费分发(即,您不必为此支付费用)。它最初的创建是为了使科学家和学生能够以交互方式可视化数学函数和数据,但已经发展到支持许多非交互式使用,如Web脚本。它还被第三方应用程序(如八度)用作绘图引擎。自1986年以来,Gnuplot得到了支持和积极的发展。
Gnuplot支持许多不同类型的输出
交互屏幕显示: 跨平台(Qt,wxWidgets,x11)或系统特定(MS Windows,OS / 2)
直接输出到文件: 后记(包括eps),pdf,png,gif,jpeg,LaTeX,metafont,emf,svg,…
鼠标网页显示格式: HTML5,svg
- Install Gnuplot
- Add environmental variable $Path
- Use TGnuPlot (glib-core/gnuplot.h):
1
2
3
4
5
6
7
8
9
10
11
12
13
14
15
16
17
18
19
20
21
22
//你没有给XY1、XY2赋值
TVec<TPair<TFlt, TFlt > > XY1, XY2;
TPair<TFlt, TFlt> temp;
temp.Val1 = 3;
temp.Val2 = 3.14;
XY1.Add(temp);
temp.Val1 = 5;
temp.Val2 = 2.14;
XY1.Add(temp);
temp.Val1 = 22;
temp.Val2 = 23.14;
XY2.Add(temp);
temp.Val1 = 33;
temp.Val2 = 36.14;
XY2.Add(temp);
TGnuPlot Gp("file name", "title name");
Gp.AddPlot(XY1, gpwLinesPoints, "curve1");
Gp.AddPlot(XY2, gpwPoints, "curve2");
//XY1中的点用线连接起来
//XY2中的数据以点形式显示
Gp.SetXYLabel("x - axis name", "y-axis name");
Gp.SavePng(); //or Gp.SaveEps();
##After executing, three files are generated
.plt file includes plotting commands for gnuplot
双击可以生成.png文件
.tab file contains the tab separated data
#
# title name (Thu Oct 26 23:00:38 2017)
#
# x - axis name curve2  x - axis name   curve1
22  23.14   3   3.14
33  36.14   5   2.14
.png or .eps is the plot
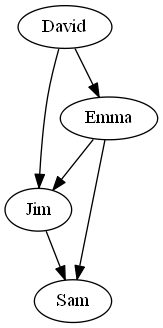
Drawing SNAP Graphs
- Use TGraphViz:Need to install GraphViz software first
- Add GraphViz path to environment variable添加环境变量路径记得添加到bin目录下
practice
PNGraph G = TNGraph::New();
G->AddNode(1); G->AddNode(2);
G->AddNode(3); G->AddNode(4);
G->AddEdge(1, 2); G->AddEdge(2, 3);
G->AddEdge(1, 3); G->AddEdge(2, 4);
G->AddEdge(3, 4);
TIntStrH Name;
Name.AddDat(1) = "David";
Name.AddDat(2) = "Emma";
Name.AddDat(3) = "Jim";
Name.AddDat(4) = "Sam";
//TGraphViz::Plot<PNGraph>(G, gvlDot, "gviz_plot.png", "", Name);
TSnap::DrawGViz<PNGraph>(G, gvlDot, "gviz_plot.png", "", Name);
//郁闷,源代码是上面的CODE,但TGraphViz这个类找不到,然后在demo-gviz.cpp找到了答案
源代码CODE
1 | // TestSnap3.cpp : 定义控制台应用程序的入口点。 |